
Most advice on reducing returns is generic: “add better photos,” “include a size chart,” “write detailed descriptions.” All true. But it doesn’t tell you which products need better photos, which size chart is wrong, or whether your returns problem is actually a product problem, a shipping problem, or a fraud problem.
The answer is already in your returns. You just need to collect it and look at it.
This guide shows how to measure your WooCommerce return rate, capture useful return reasons, and turn them into fixes that bring the rate down.
What’s a “normal” return rate?
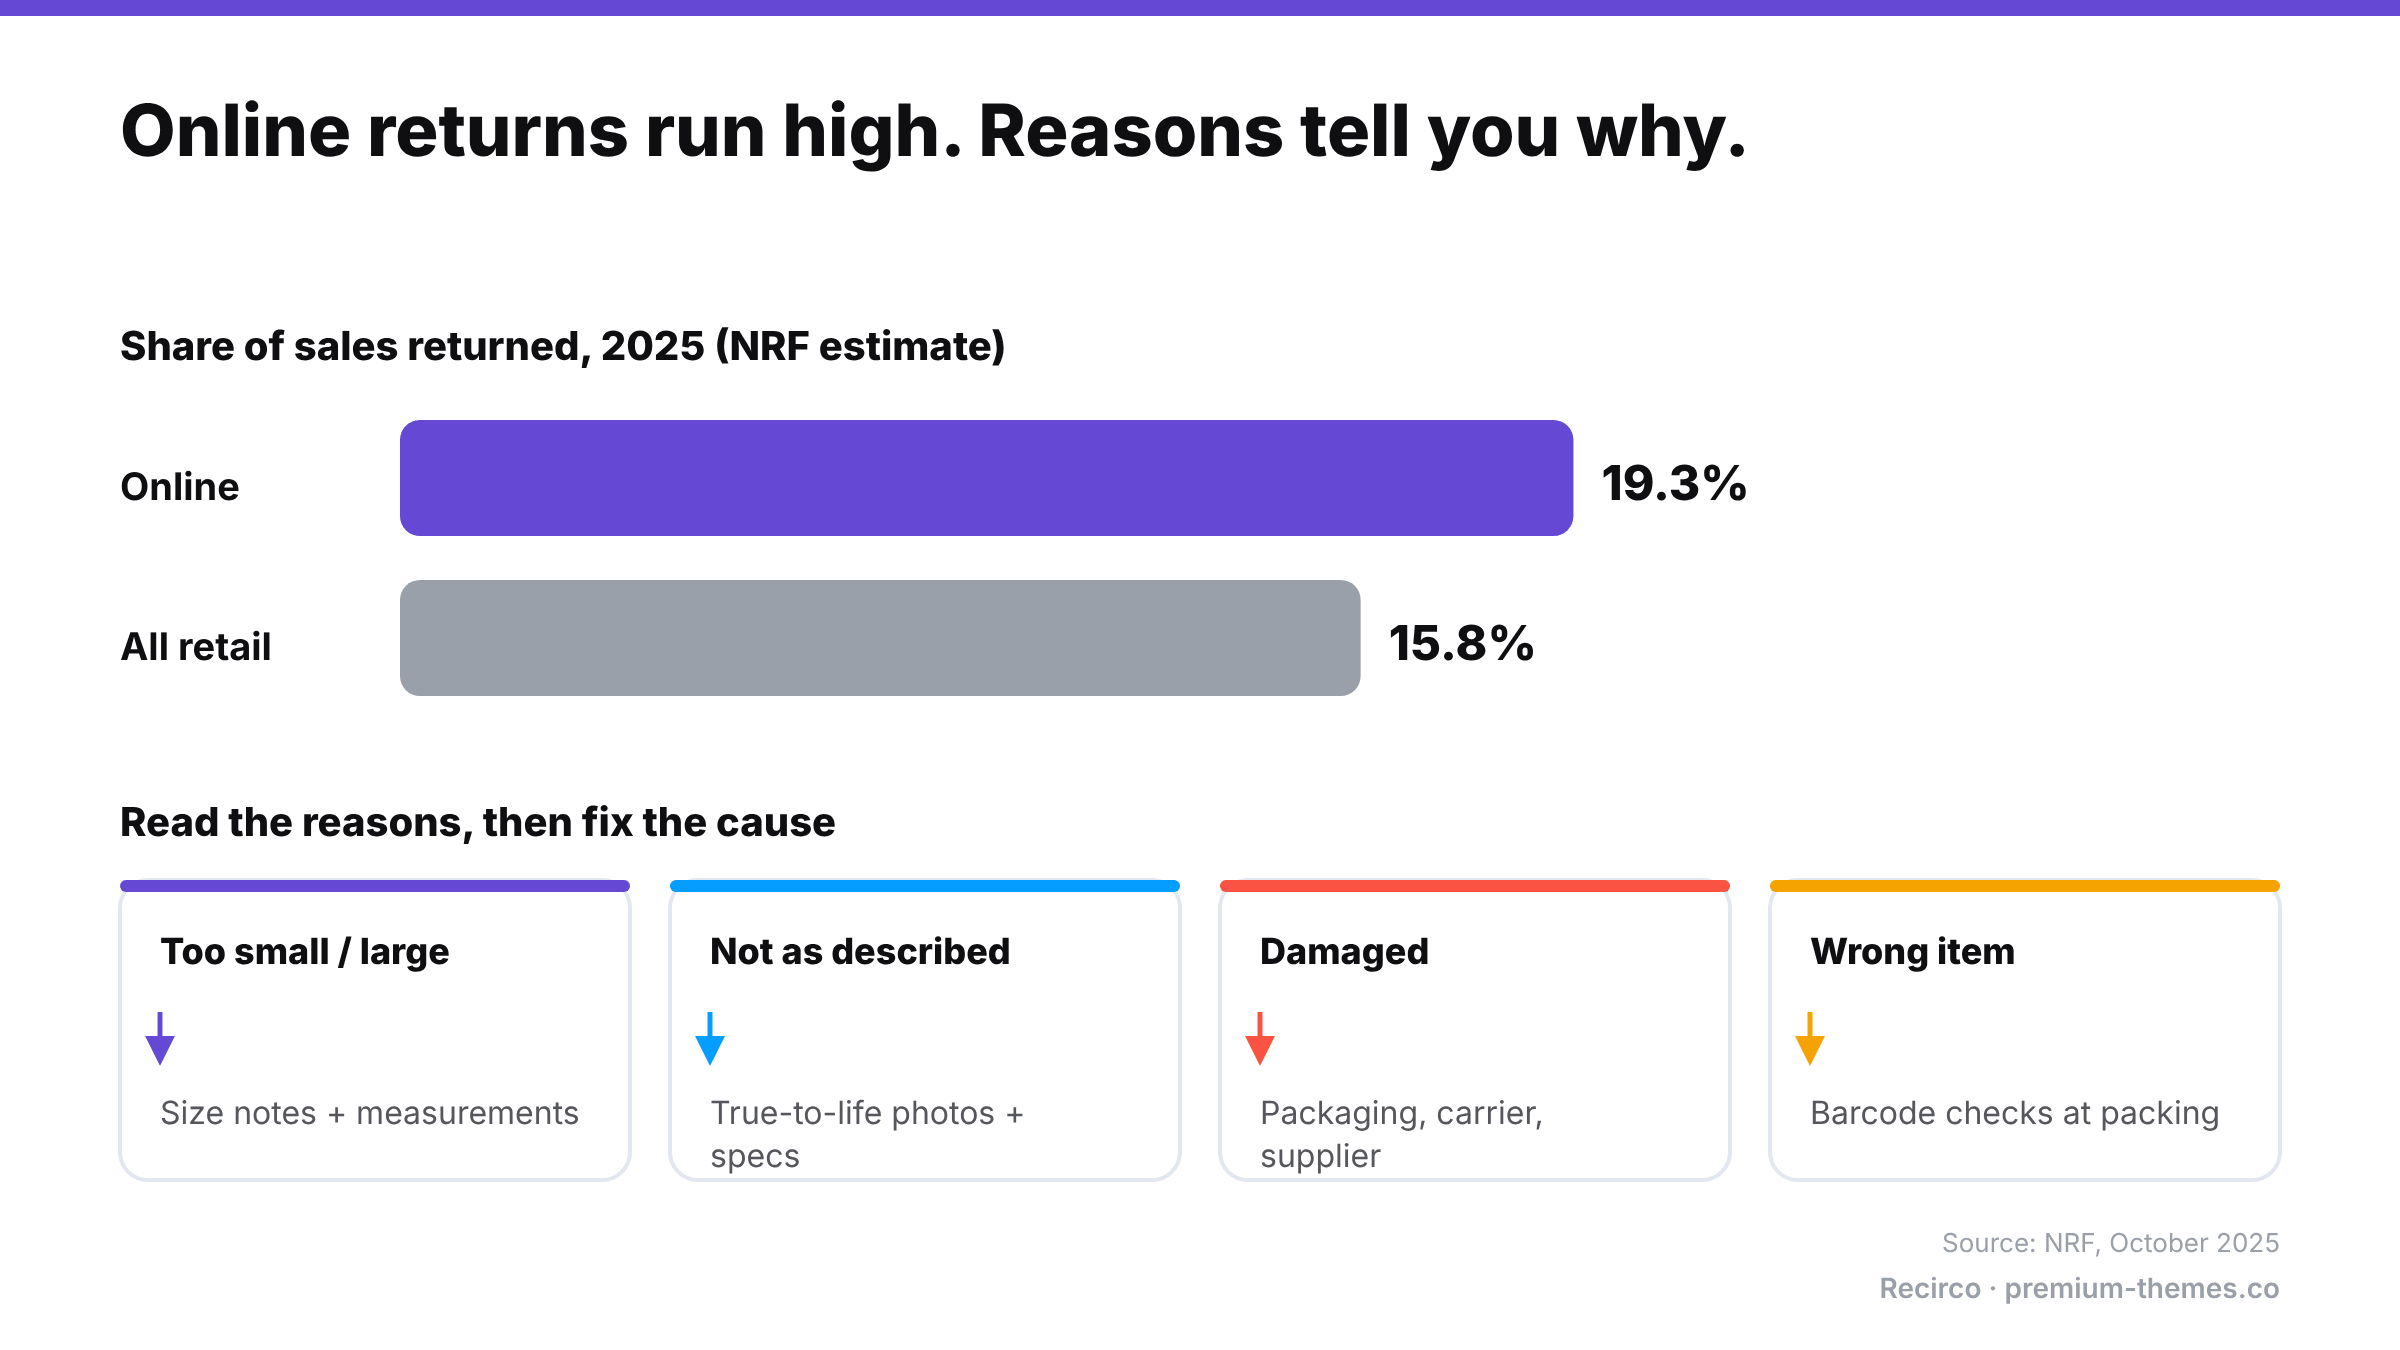
It varies hugely by category. Apparel and footwear sit far higher than electronics accessories or consumables. As a broad benchmark, the National Retail Federation estimated 19.3% of online sales would be returned in 2025, against 15.8% for retail overall (NRF, October 2025).
Your own trend matters more than the industry average. A store going from 12% to 9% has saved real money, whatever the benchmark says.
How to calculate your return rate
Use one of these consistently:
- By units: units returned ÷ units sold × 100
- By value: value returned ÷ value sold × 100
- By orders: orders with a return ÷ total orders × 100
Value-based is usually the most useful for decisions, because returning one $300 jacket matters more than returning one $8 accessory. Calculate it per product and per category, not just store-wide. Averages hide the two or three products causing most of the problem.
Step 1: Collect a reason on every return
You can’t fix what you can’t see. If returns arrive by email, reasons are scattered across threads, inconsistent, and often missing.
A good reason list is short, specific and actionable. For example:
- Too small
- Too large
- Not as described / looks different from photos
- Damaged or defective
- Wrong item sent
- Changed my mind / no longer needed
- Arrived too late
Make detail required for reasons you can act on (“Damaged”: what was damaged? “Not as described”: what was different?) and optional for the rest.
One caution: shoppers don’t always tell the truth about why they return. Loop’s 2026 survey found only 39% always give the true reason for a return (Loop Returns, July 2026). “Changed my mind” is often under-reported because people pick a reason that sounds more legitimate. Look for patterns across many returns, not individual answers.
Step 2: Find your problem products
Rank products by:
- Number of returns
- Value returned
- Return rate (returns relative to sales, so best-sellers don’t dominate unfairly)
Then look at the reasons for the top 10. You’ll usually find a small number of products with a very clear, dominant reason.
Step 3: Match each reason to a fix
| Dominant reason | Likely cause | Fix |
|---|---|---|
| Too small / too large | Sizing runs off, unclear size guide | Product-specific size notes (“runs small, size up”), measurements in cm/in, fit photos on models with heights |
| Not as described | Photos or copy mislead (colour, material, scale) | True-to-life photos, scale references, accurate material and dimension details |
| Damaged or defective | Packaging, carrier, or supplier quality | Better packaging; compare by carrier; raise with supplier |
| Wrong item sent | Picking errors | Barcode checks, clearer SKUs, review fulfilment process |
| Arrived too late | Shipping estimates too optimistic | Honest delivery estimates, especially near holidays |
| Changed my mind | Impulse buying, unclear expectations | Better product info, reviews, comparison content |
Step 4: Fix the product page, then measure again
Make one change per product, note the date, and compare that product’s return rate and reasons over the next 30–90 days. Return data lags sales, so give it time.
Step 5: Keep an eye on speed and cost
Two more metrics worth tracking:
- Average days to resolve a return. Slow returns create support tickets, chargebacks and unhappy customers. 71% of consumers say they’re less likely to shop with a retailer again after a poor returns experience (NRF).
- How returns end: refund vs exchange vs store credit. Reducing returns is one lever; keeping revenue from the returns you do get is the other. (See Exchanges vs refunds.)
Don’t reduce returns by making them harder
It’s tempting to cut returns by hiding the policy, shortening the window, or making the process painful. It works briefly and costs more in the long run: fewer first-time buyers, more chargebacks, and more negative reviews. Shoppers check return policies before buying, and a hostile one loses you the sale before a return ever happens. The goal is fewer unnecessary returns, not fewer possible returns.
Collecting and analysing return reasons in WooCommerce
WooCommerce doesn’t record return reasons or track returns as their own records, so there’s nothing to report on natively.
Recirco – Returns & Exchanges for WooCommerce (free) captures a reason on every returned item through a self-service portal in My Account. It comes with six reasons pre-loaded that you can edit, and each can require an explanation. Every return is stored as a structured record in your own database, so the data is there from day one.
Recirco Pro turns that data into returns analytics:
- Requests over time (a gap-free daily series, so quiet days show as zero rather than disappearing)
- Value returned
- Average days to resolve
- Reasons ranked by count and by value
- Most-returned products
- Date ranges of 7, 30, 90 and 365 days
That’s exactly the data you need for steps 2 to 5: which products, which reasons, how much money, and how fast you’re resolving them.
A monthly returns review (30 minutes)
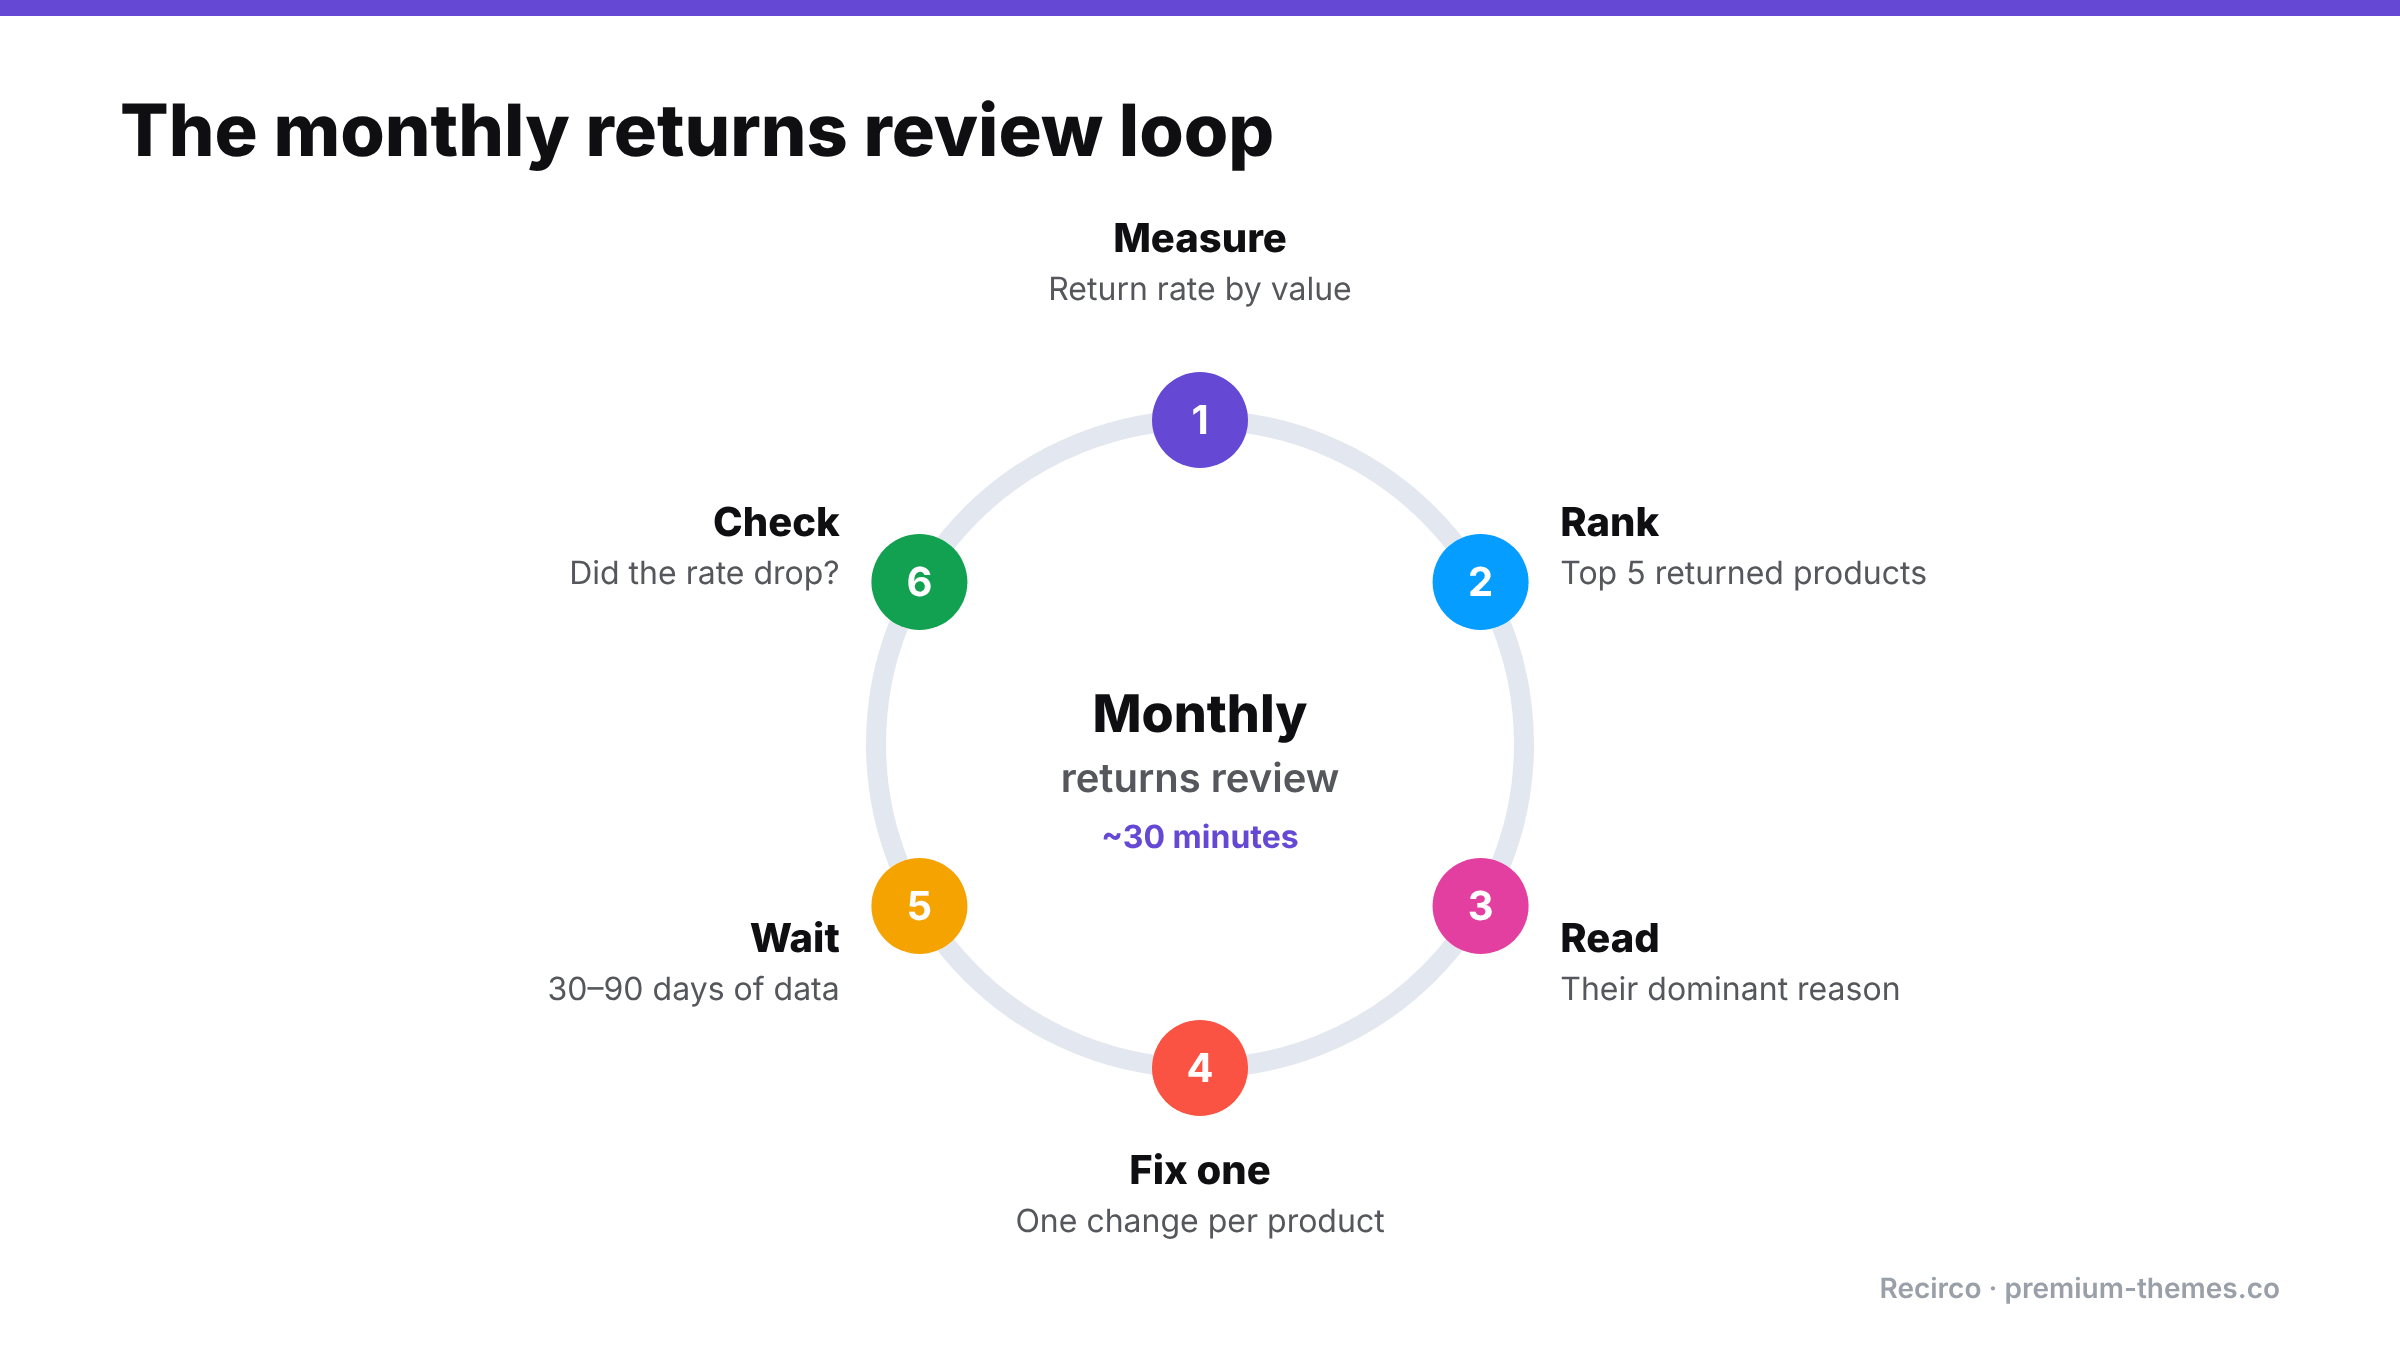
- Check your overall return rate by value against last month.
- List the top 5 most-returned products and their dominant reasons.
- Pick one product and make one fix.
- Check last month’s fix: did that product’s rate or reason mix change?
- Check average days to resolve, and whether it’s getting slower.
- Check the share of returns ending as exchange or store credit.